Chapter 1: The Architecture of Inequality
Measurement & Architecture Establishes the methodological foundations of the R-C-M framework, contrasting Total Population Cutoffs (TPC) with Race-Specific Cutoffs (RSC) and introducing the Functional Materiality Assessment (FMA) to determine if statistical gaps translate into lived capability.
Podcast:
Infographic:
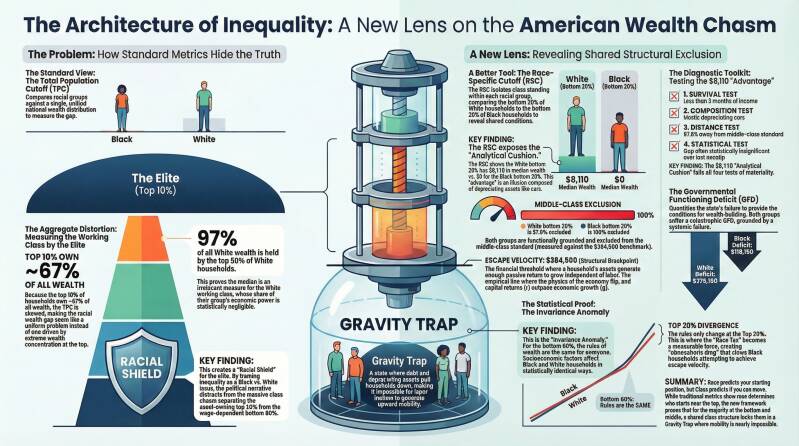
The Architecture of Inequality
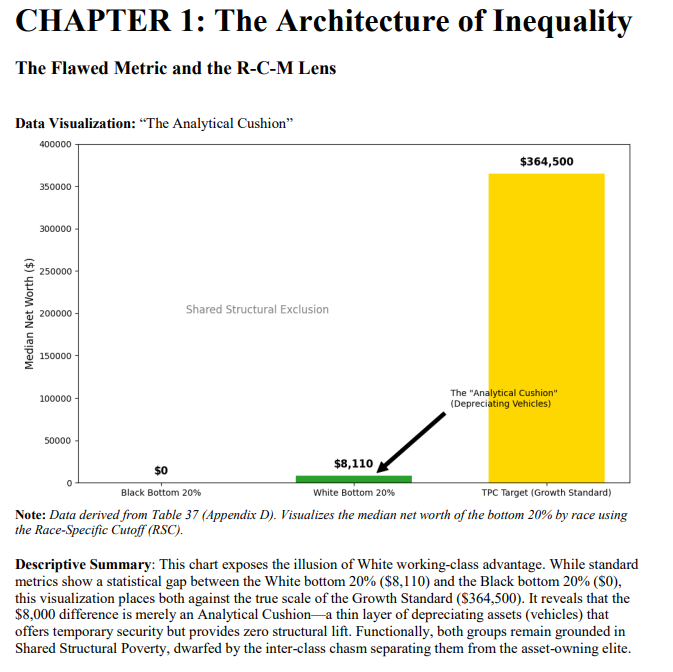
Summary: This graphic introduces a new analytical lens to reveal shared structural exclusion that traditional metrics hide.
The Standard View (TPC): Illustrates how comparing national medians (Black vs. White) creates an Aggregate Distortion.
The Aggregate Distortion: Shows that the top 10% own approximately 67% of all wealth, making the median an irrelevant measure for the working class.
The RSC Lens: Introduces the Race-Specific Cutoff, showing that the White bottom 20% has an Analytical Cushion of $8,110 compared to $0 for Black households.
The Gravity Trap: A visual of a bell jar containing households where debt and depreciating assets (like cars) prevent labor from generating upward mobility.
The Invariance Anomaly: Notes that for the bottom 80%, the rules of wealth are statistically identical regardless of race.