Chapter 5: Generational Stratification
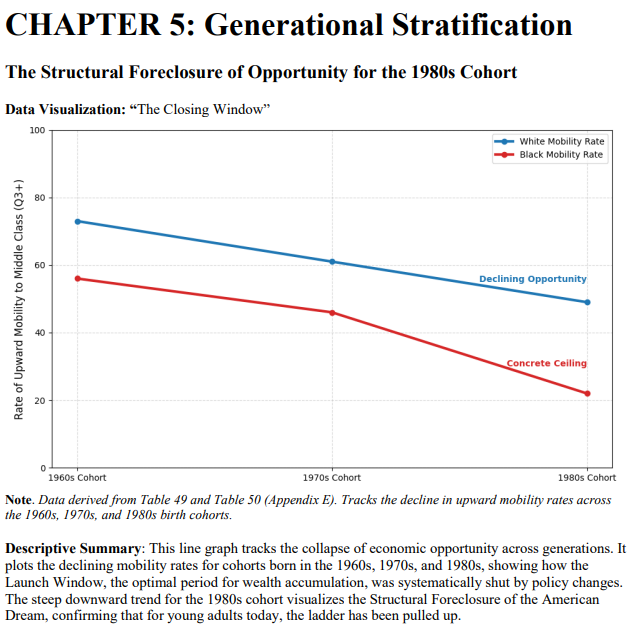
Utilizes cohort analysis to track the collapse of economic opportunity across generations (1960s, 70s, and 80s cohorts), proving that the path to Escape Velocity was effectively fenced off during their foundation phases.
Podcast:
Infographic:
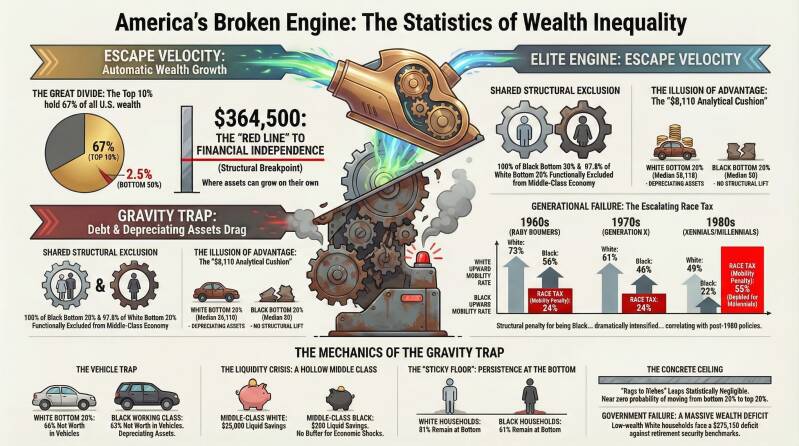
America's Broken Engine
Summary: Detailed statistics on the Red Line to financial independence and the generational failure of the Race Tax.
Structural Breakpoint: Identifies $364,500 as the "Red Line" where assets can grow independently of labor.
The Vehicle Trap: 66% of net worth for poor White households and 63% for Black working-class households is tied up in depreciating vehicles.
Generational Failure: Re-emphasizes the doubling of the Race Tax from 24% (1960s/70s) to 55% (1980s).